We are always looking for new ways to make the information generated by Triage more accessible and useful to organisations. Triage is likely only one element of a much larger security infrastructure, and we want it to be easy to incorporate sandbox reports into existing workflows. As a major step towards this, we are pleased to share that Triage integration is now available for the Security Orchestration, Automation and Response (SOAR) platforms Splunk Phantom and Cortex XSOAR.
In this blogpost we will give a quick guide to getting started with these integrations, and show how to add Triage as a data source to these platforms.
You can find more information about Triage for commercial usage on our website.
Jump to section:
We hope that the content below is enough to get you started with these new integrations. As usual if you have any questions or feedback feel free to get in touch and we’ll do our best to help.
Splunk Phantom
Installing the Application
Triage can be installed as an App in any Splunk Phantom instance. After logging into the platform, go to the main dashboard and select Apps from the dropdown menu.
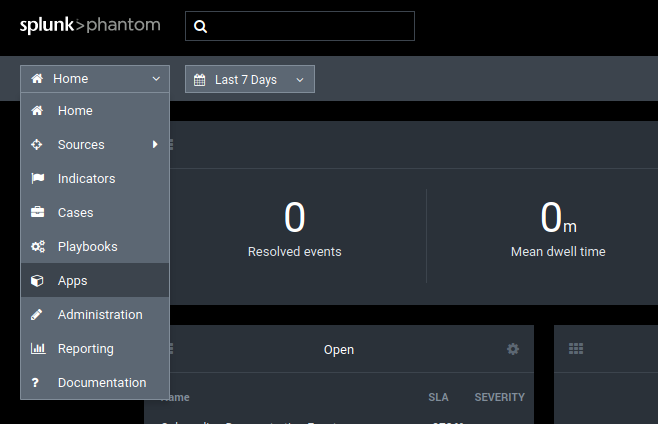
Select 'Apps' from the menu
At the top right of the Apps window select Install App.
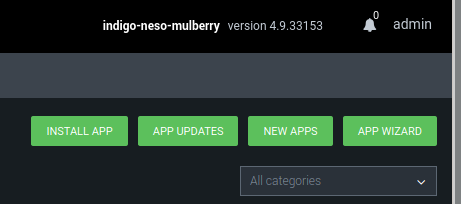
Select 'Install App'
Select the Triage App tarball we will provide to commercial users or drag and drop it into the window, and select Install.
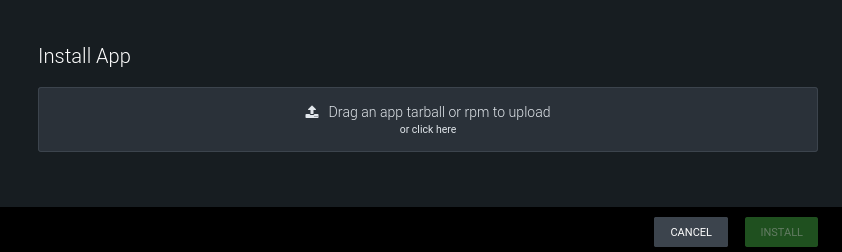
Choose the installation file and click 'Install'
Once the installation has completed, there are a few things to configure before the App is ready to use.
Configuring an Asset
Once installed you will see some basic information which can be set however you want. The main ones we are interested in are under the Asset Settings tab - here is where we tell the App how to talk to the Triage server.
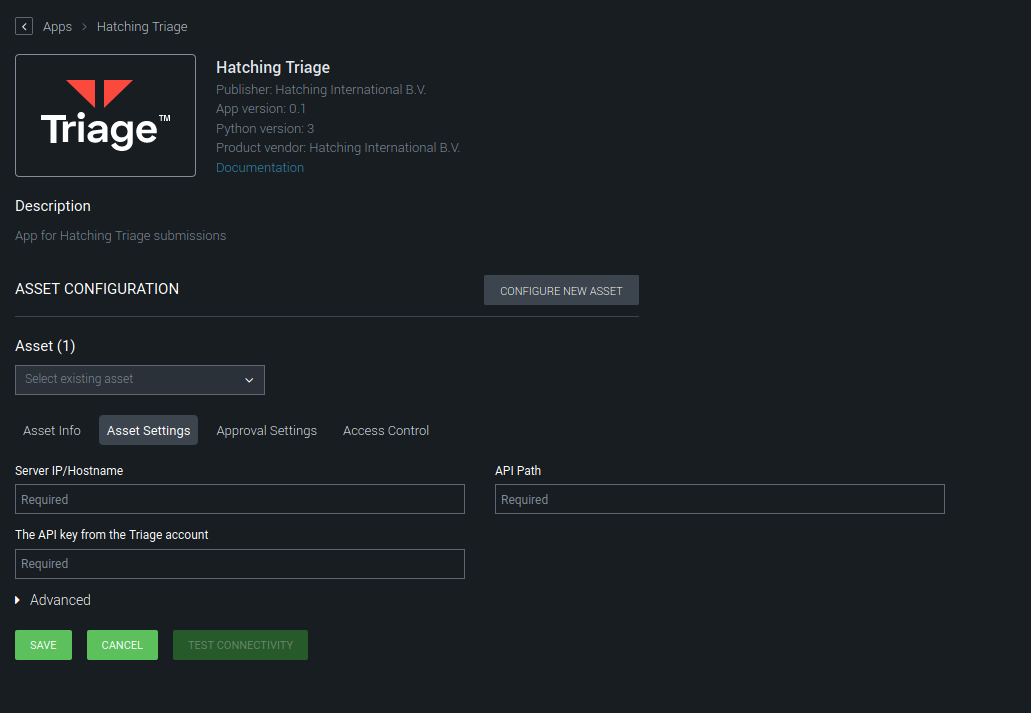
Go to 'Asset Settings' to configure the App
There are 3 things here you need to configure:
-
Server IP/Hostname The hostname of the Triage instance you use. If you’re setting up Splunk with a private cloud instance that would be
private.tria.ge. For the public cloud this would beapi.tria.ge. -
API Path The path to the root of the API endpoint. For private clouse instances this would be
/api/v0/. For the public cloud this would be just/v0/. -
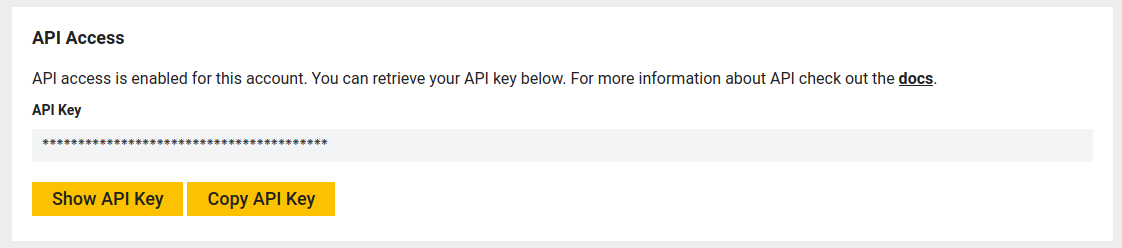
API key Here is where you enter the API key from the Triage account you want to connect. This can be found on your account page in the web UI.
That’s it! Triage is now installed and ready to use as a data source in Playbooks.
Using Triage in a Playbook
Currently the Triage App support 2 investigative actions:
- Detonate file
- Detonate URL
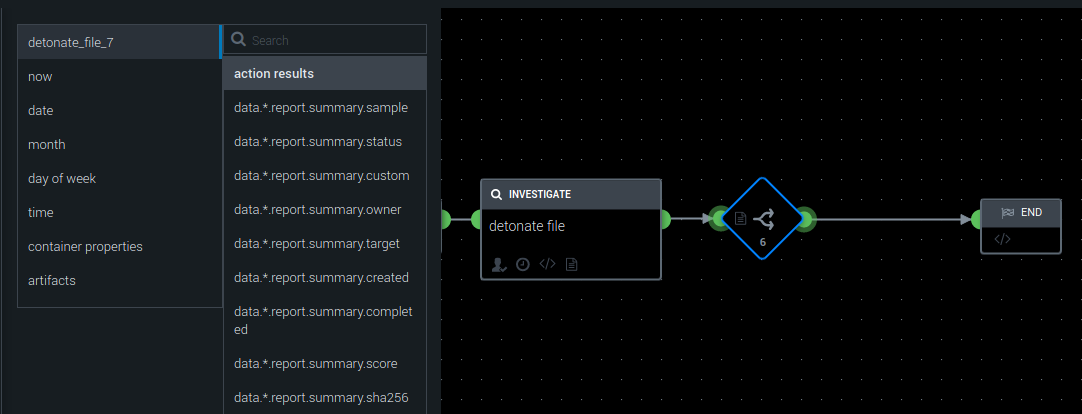
To add an action to a Playbook, select the green connector on the start node.
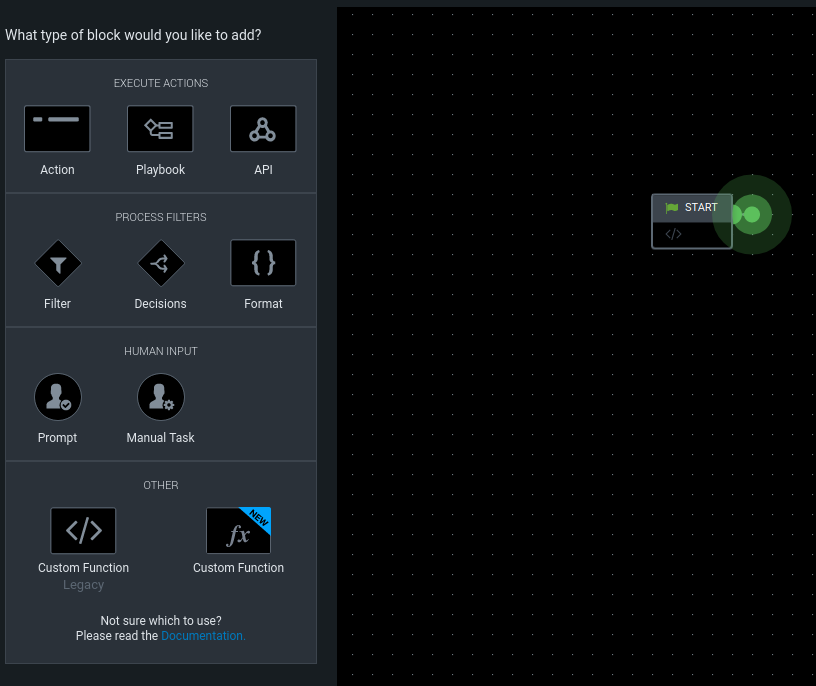
Press ‘Action’ in the menu on the left and select ‘Hatching Triage’.
You can now select the preferred action and what information is passed into the Playbook. All the information from the Triage report is available to choose from, but the most important data is generally found in the summary section.
Selecting an Analysis Profile
Triage Profiles can be used to customise various parameters of the analysis, such as internet connectivity or the maximum time the sample will be run for. They can be created and modified through the Profiles page when logged into Triage (only available to Researcher accounts on the public server).
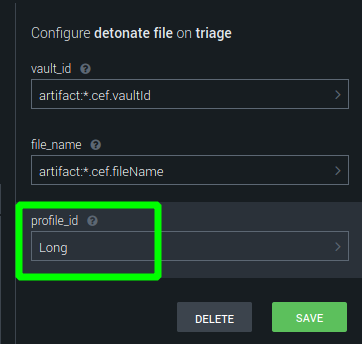
By default the file or URL action will run with the standard ‘Automatic’ profile, but this can be configured in the settings for the Action in a playbook.
For example to choose a profile with the name Long defined on Triage as follows:
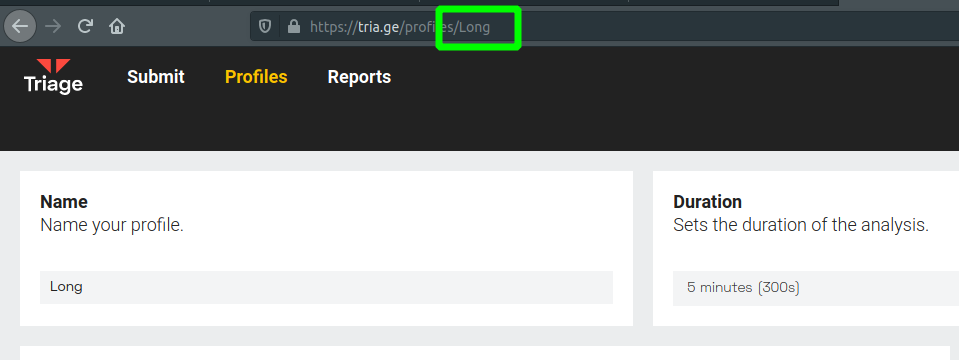
Simply add that profile name into the profile_id field of the Detonate File or Detonate URL action in Splunk.
Cortex XSOAR by Palo-Alto Networks
Thanks to the team at Palo-Alto Networks there is now an integration for Hatching Triage available through the Marketplace of their Cortex XSOAR platform. It can be downloaded free of charge and configured to pull data from a Triage instance - all you need is a valid Triage API key, available to public Researcher accounts and Private Cloud customers.
The integration supports all of the endpoints available through the Triage API, providing full access to submit samples and fetch results, as well as management tasks like adding users or managing profiles. The commands can be run manually through the XSOAR Playground, e.g. !triage-query-samples, or in Playbooks for automated analysis tasks.
The sections below should get you started with deploying the new integration.
Installing the Triage Integration
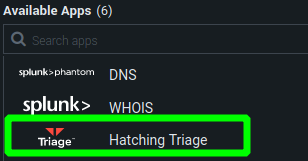
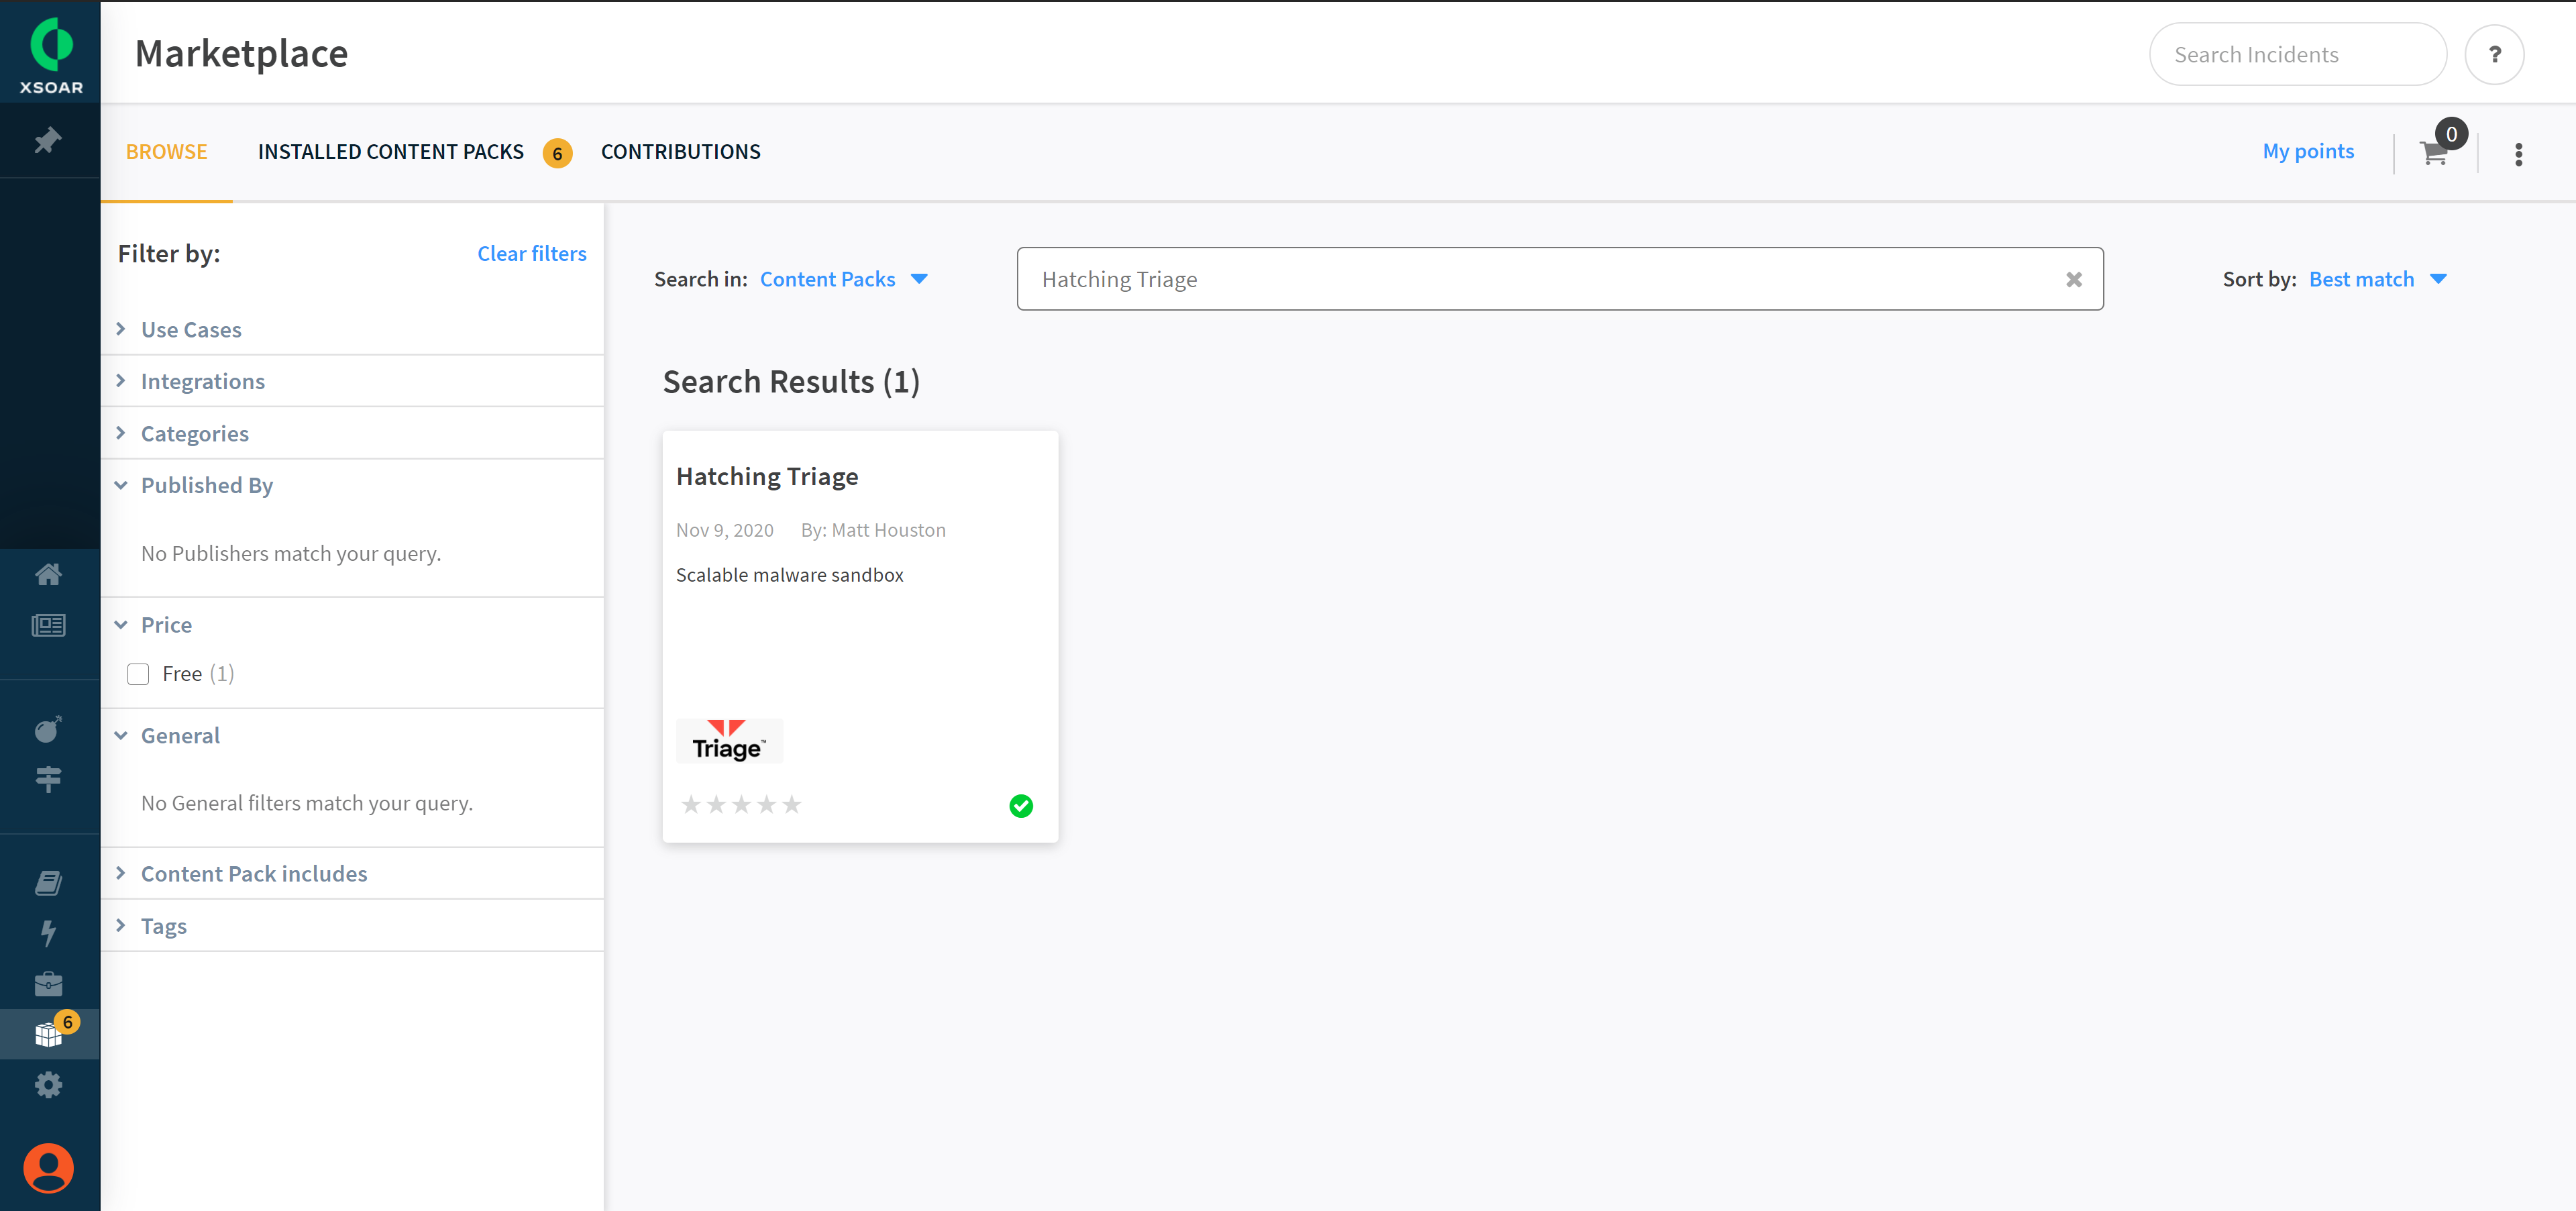
The first step is to download and install the package for your XSOAR deployment. Just go to the Marketplace, search for ‘Hatching Triage’, and install the integration shown.
Once the package is installed, there are a few settings to configure before the integration can be used. Go to Settings in the menu on the left then Integrations -> Server & Services. Find the Hatching Triage integration and click Add instance to open the configuration dialog.
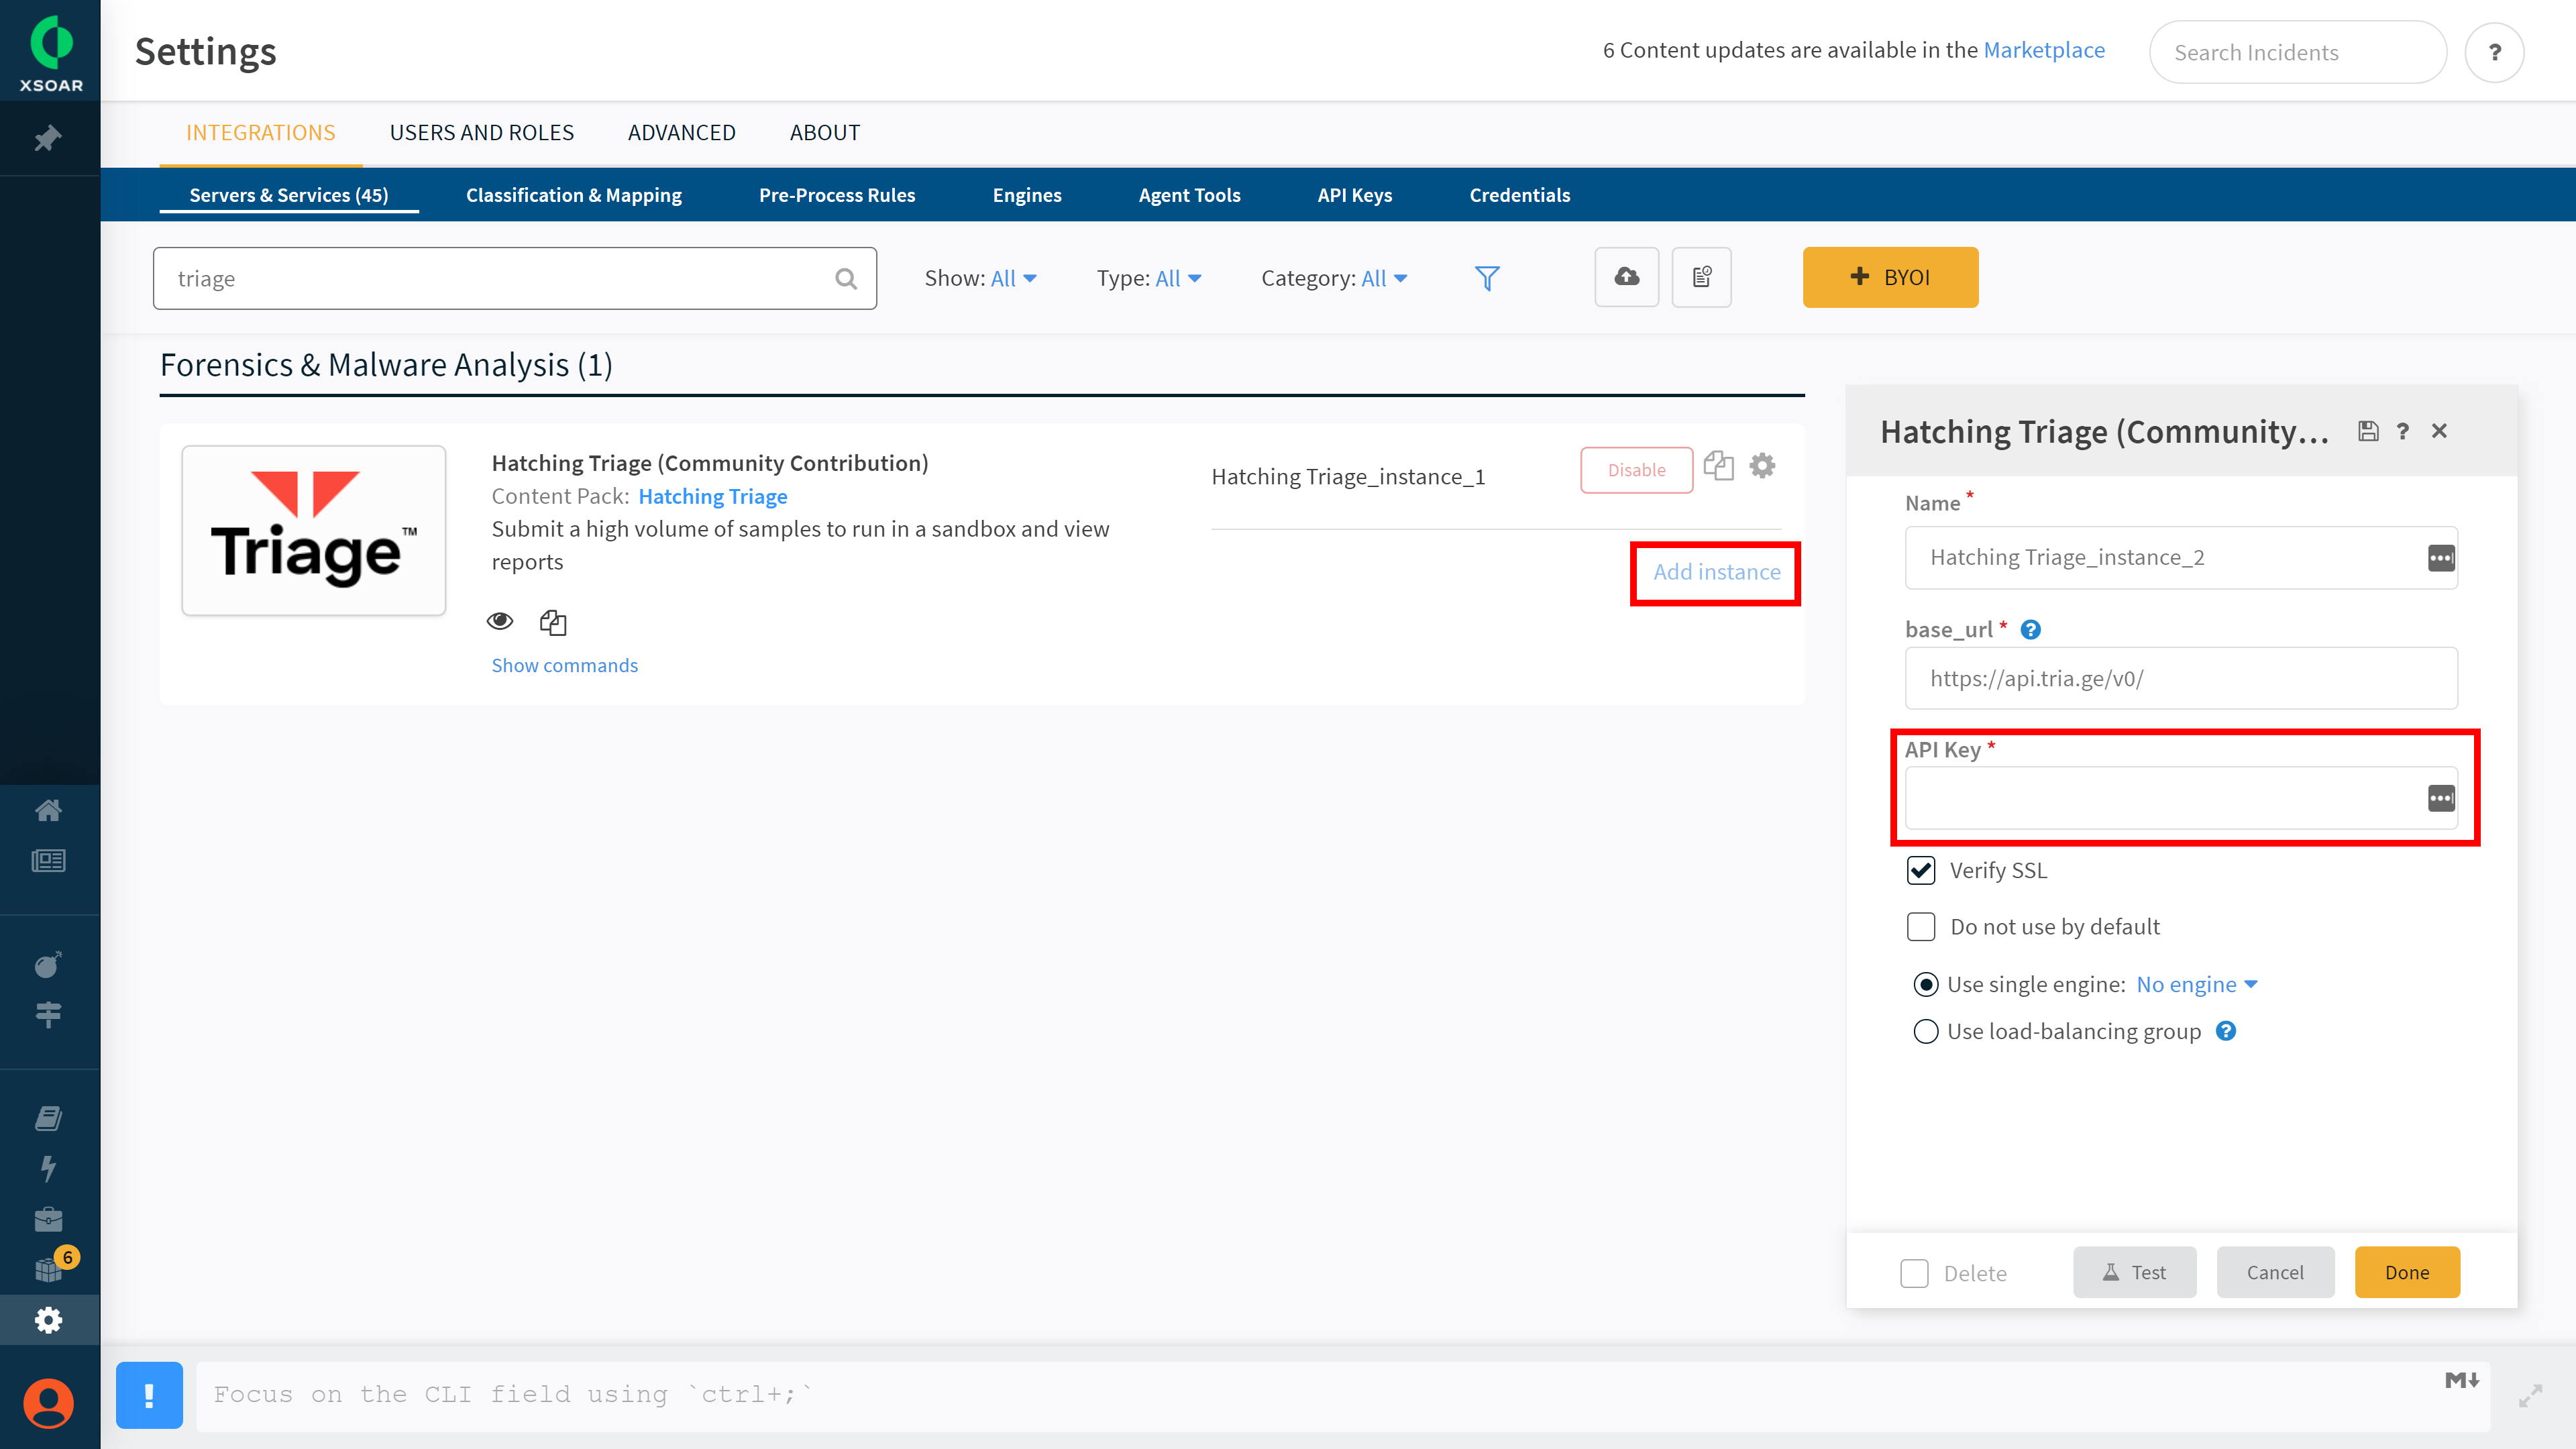
The base_url field points to the API endpoint and by default is set to the public tria.ge server. For Private Cloud users this should be set to https://private.tria.ge/api/v0/.
Paste your Triage API key into the API Key field. This can be found on your profile page
Click Done and the integration is now ready to use! Commands supported by it begin with the word triage - a basic summary of these is shown below.
| Command | Description |
|---|---|
triage-query-samples |
List all samples visible using the provided API key |
triage-submit-sample |
Submits a file or URL for analysis |
triage-get-sample |
Fetch basic information about an analysis |
triage-get-sample-summary |
Fetch a summary report for the sample ID provided |
triage-delete-sample |
Delete an analysis |
triage-set-sample-profile |
When a sample is in the static_analysis status, a profile should be selected in order to continue. |
triage-get-static-report |
Get the static analysis report for a sample |
triage-get-report-triage |
Fetch the full Triage report for a single behavioural analysis task |
triage-get-kernel-monitor |
Fetches the onemon.json file which logs all VM activity during analysis |
triage-get-pcap |
Fetch the PCAP of an analysis for manual investigation |
triage-get-dumped-file |
Fetch files dumped during behavioural analysis. The names can be found under the “dumped” section of the Triage report |
triage-get-users |
Return all users within the company as a paginated list. Returns a single user if a userID is provided |
triage-create-user |
Creates a new user and returns it’s details. The user will become a member of the company the requesting user is a member of. |
triage-delete-user |
Delete a user and all associated data, invalidating any sessions and removing their API keys. Any samples submitted by this user are kept. |
triage-create-api-key |
Creates a new key which can be used to make API requests on behalf of the specified user. The user should have been granted the access_api permission beforehand |
triage-get-api-key |
Lists all API keys that the user has. |
triage-delete-api-key |
Delete the specified API key from the user’s account. |
triage-get-profiles |
List all profiles accessible with the provided API key. |
triage-create-profile |
Create a new analysis profile with the defined settings. |
triage-update-profile |
Update the profile with the specified ID or name. The stored profile is overwritten, so it is important that the submitted profile has all fields, with the exception of the ID |
triage-delete-profile |
Delete the specified analysis profile. |
Using Triage in XSOAR Playbooks
The Triage commands shown above can all be used in Playbooks when creating automated workflows once the module is installed and configured.
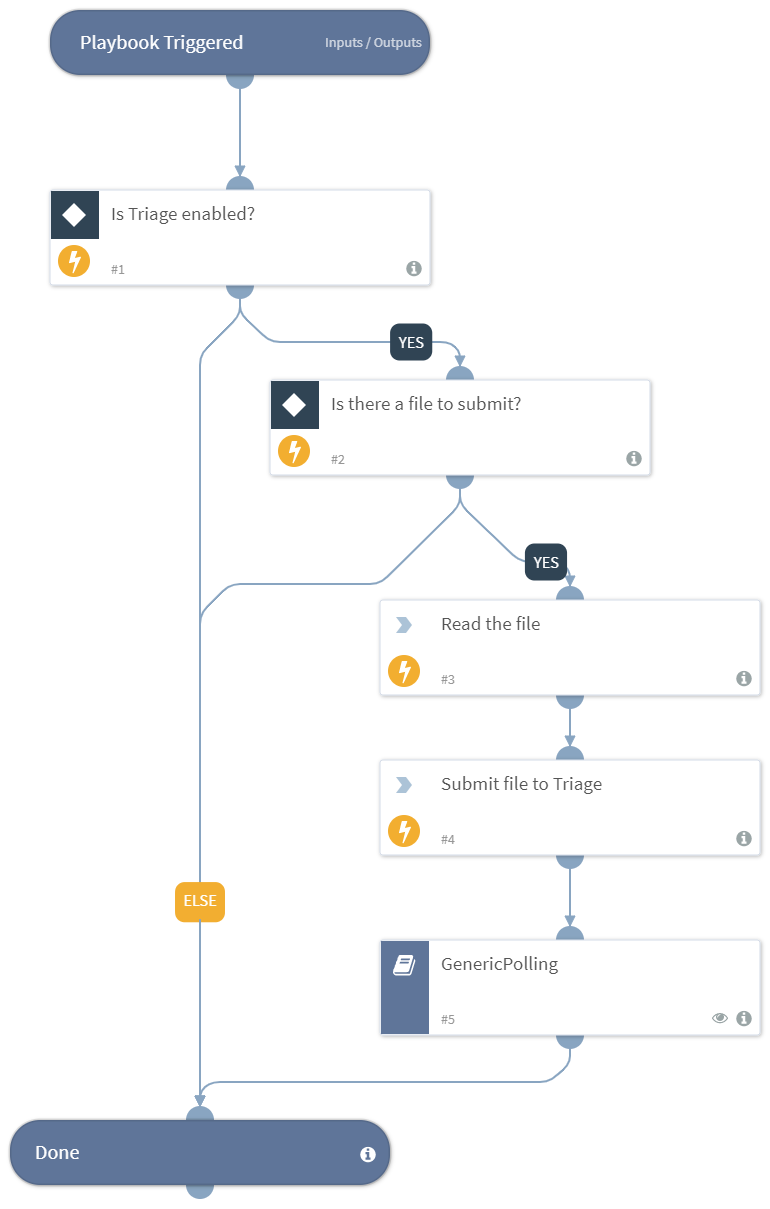
Example Playbook for submitting a file to Triage
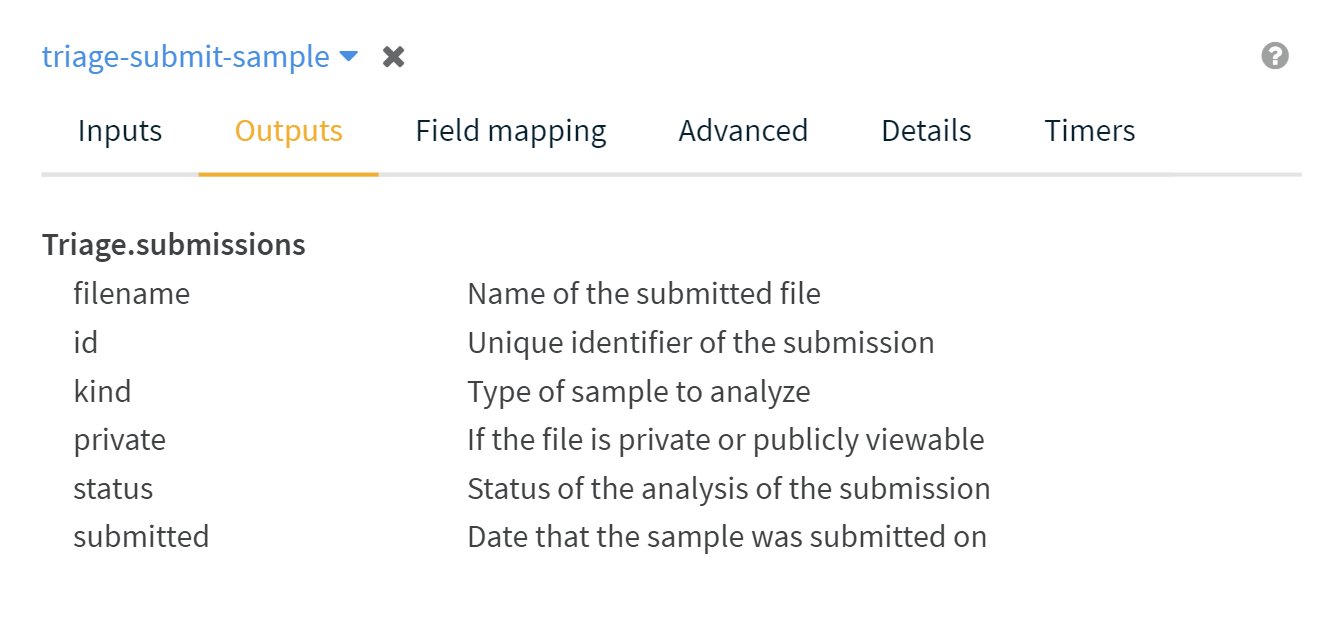
To add a node, simply create a new task and use the dropdown list to choose the relevant command. The dialog box will then update to show the fields which are available for this API request. For example, when submitting a sample using triage-submit-sample the configuration resembles the screenshot below.
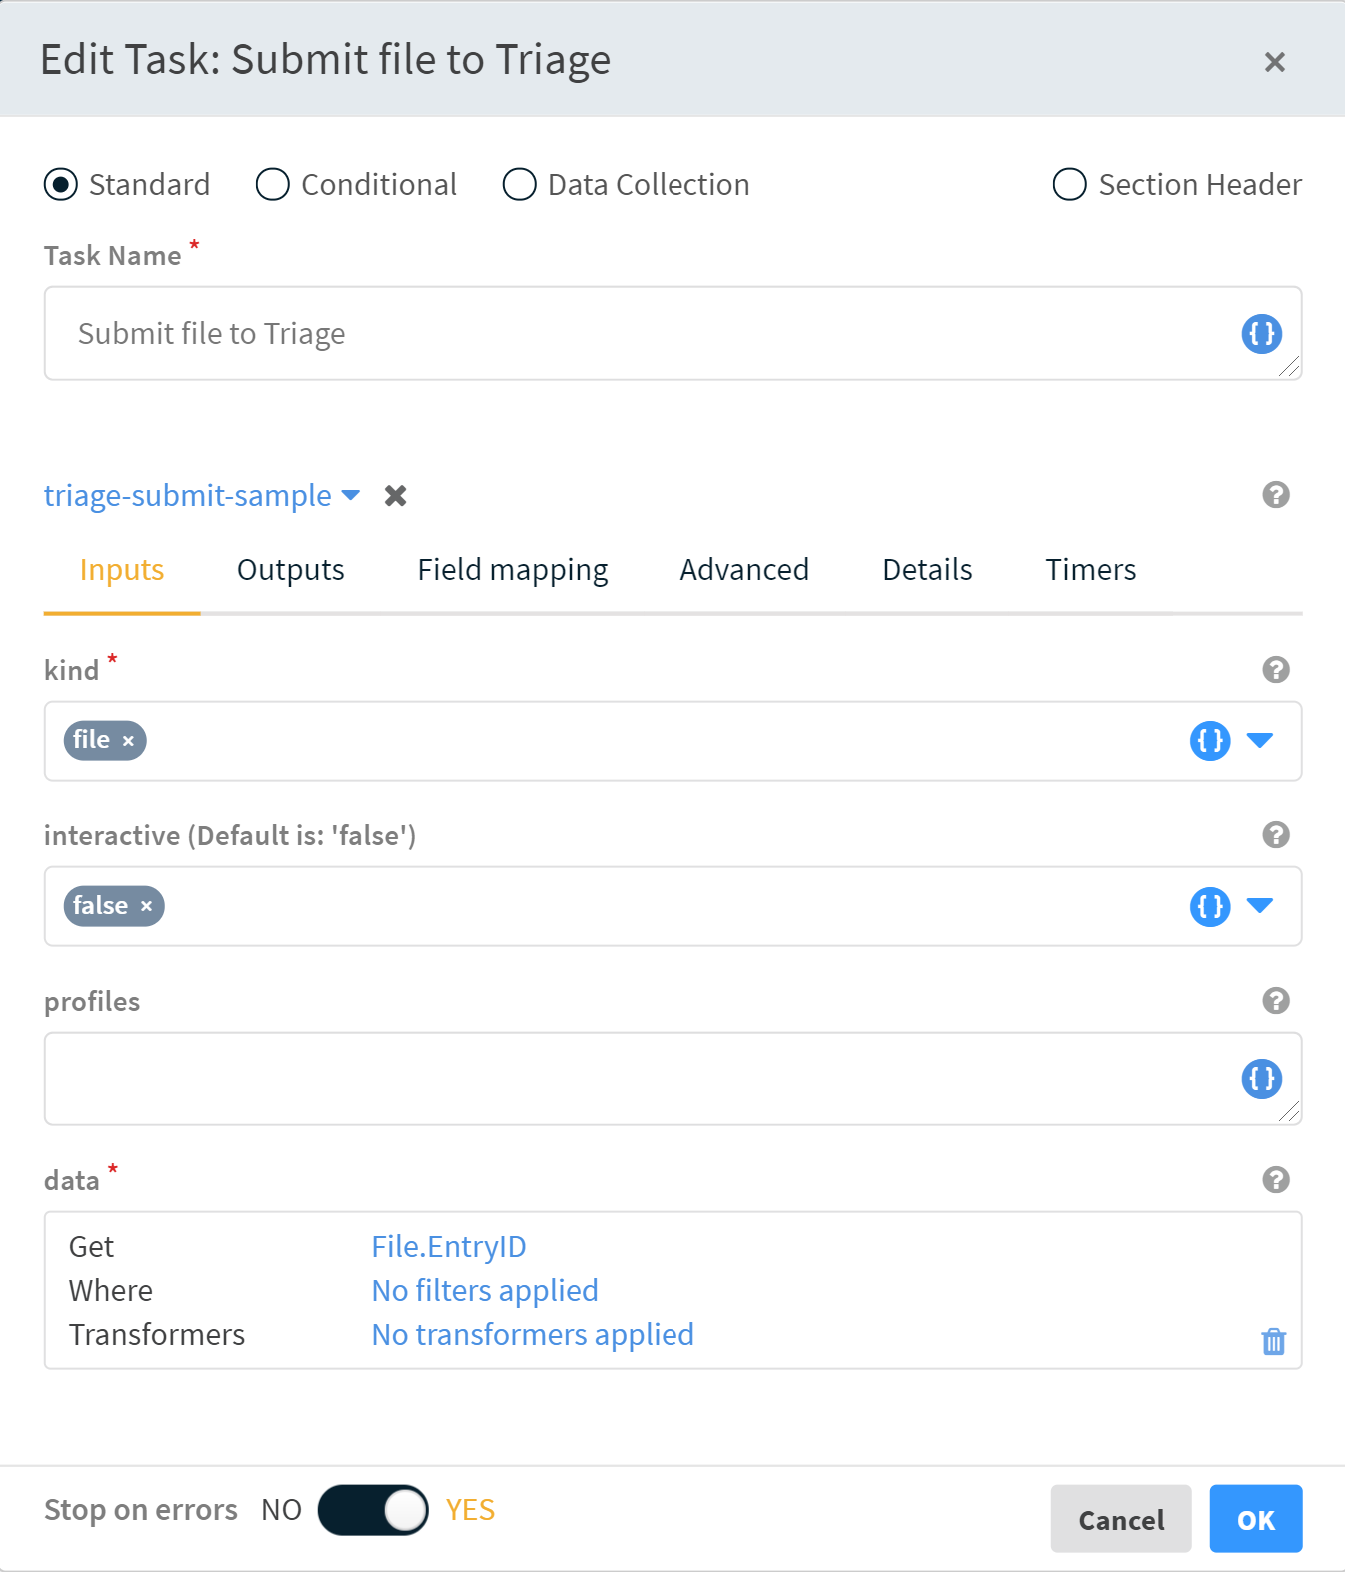
The outputs which are then available for further processing can be seen in the Outputs tab of the configuration dialog box. For example to fetch the ID of the new analysis use the value Triage.submissions.status.