

It’s Triage Thursday, and we’re pumped to share our latest updates over the past week. As usual, we’ve beefed up our malware detection coverage to catch those sneaky bad guys along with their latest malware. Keep an eye out for all the cool stuff we have in store for you every Thursday!
This week, we’ve got some great news to share alongside our regular malware updates changelog. We’re delighted to introduce a new feature called Deeplinks to our reports, which will make your experience with the Sandbox even better.
Let’s check it out at what’s new this week:
Deeplink
The Processes and Network sections on the UI now have two handy buttons that make it super easy to share specific processes and network requests and explore Analysis Logs with specific process ID or network flow. You can find these two buttons in both sections for now, and it is coming to the downloads section soon!
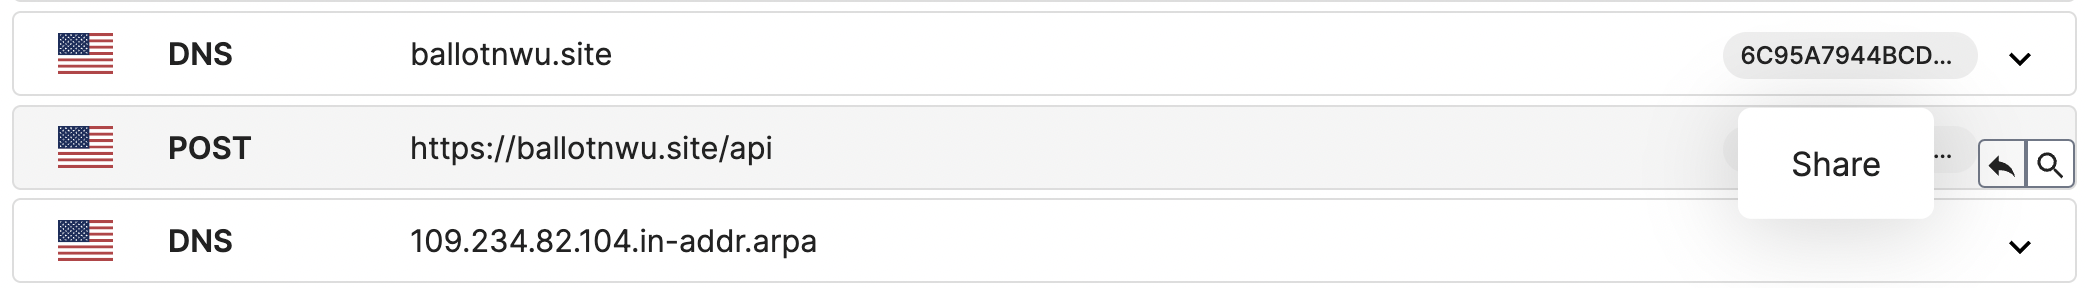
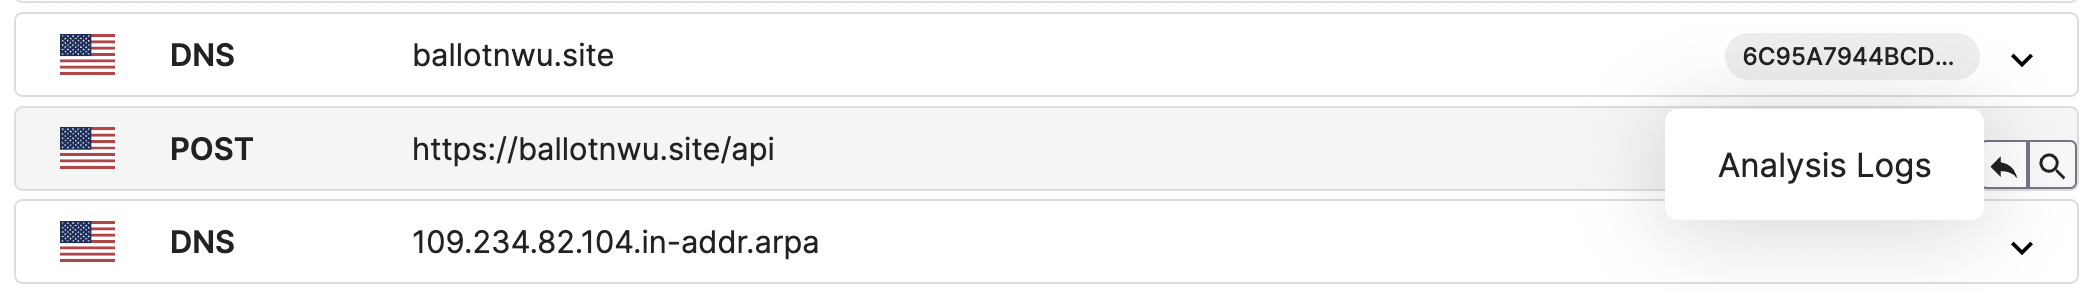
Simply hover your mouse over the process or network flow you want to learn more about, and two buttons will pop up. The Share button lets you easily share the suspicious process or potential C2 network request with the community. The Analysis Logs button allows you to explore the specific indicator in the Analysis Logs for further investigation.
Let’s take a Lumma Stealer (sha256: 6c95a7944bcdf65faa0a1cfb24c7996a084259e0e84feeec73d6926d37a5517e) as an example to go through this feature. Once the analysis is complete, you can view it in the VM report.
New Deeplinks for sharing specific processes and network requests
If you suspect any part of this sample’s process or network flow and want to save and share it with others, simply click the Share button to copy this specific section. This will provide you with a link to this particular section of the PID or network flow. For example, you can obtain the link below to directly access this suspicious C2 network flow by clicking the Share button:
Explore network requests/processes easier with analysis logs enrichment
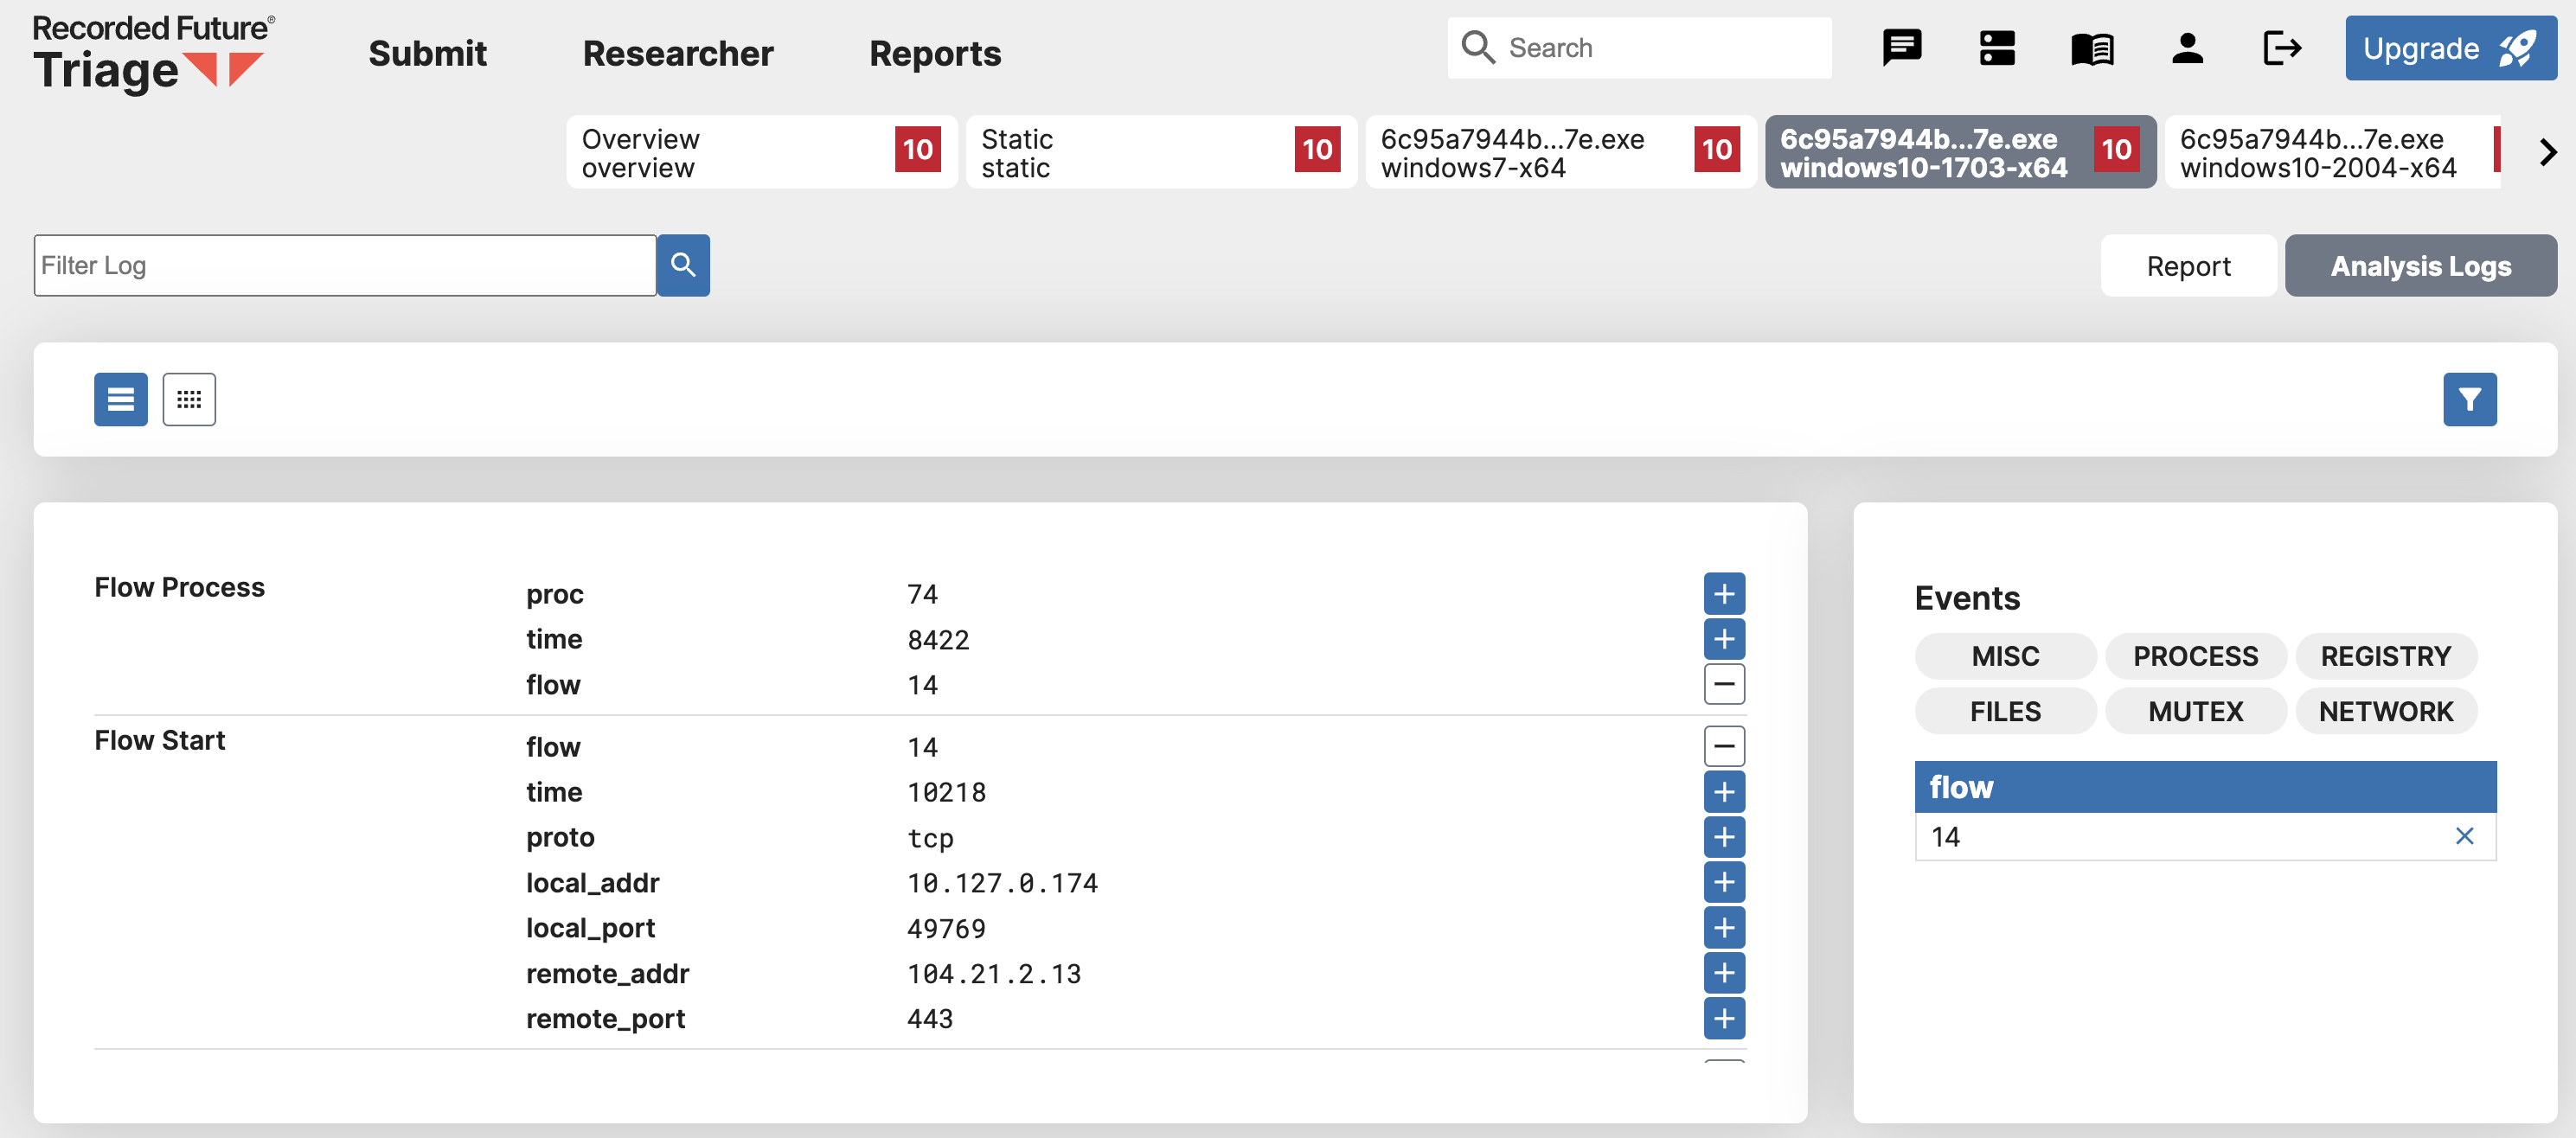
To investigate the activity of a specific process or network flow, simply click on the Analysis Logs button. This will direct you to the Analysis Logs page, where you can explore the process or network flow in question. Let’s use the link above to see how clicking the Analysis Logs button will take us to the Analysis Logs. After that, you can get to the Analysis Logs page with the specific PID or network flow you want to take a closer look at.
We hope you enjoy this fantastic feature and stay tuned for more amazing things coming soon.
Now, let’s move on to the detection updates and additions for this week!
New Families This Week
- Added detection and extraction support for Redosdru family, Windows loader
- Added detection and extraction for SugarGh0st family, Windows trojan
- Added ransomnote extractor for Monti, Windows Ransomware
Updates for Existing Families
- Updated detection and extraction for AxBanker banking trojan undetected sample
- Updated detection and extraction for Lumma Stealer unextracted samples
If you have any feedback, questions, or issues about Triage feel free to reach out to us any time - we do our best to respond to all feedback but even if we can’t get back to you straight away your files will go into our list of things to review and help us prioritize tasks.
You can find us directly through the website, or using the Feedback option on an analysis report page.
Not signed up yet? Head over to tria.ge to register for a free account.